Financial management
Objective
- Sustainable long-term financial structure
Key performance indicator |
Target |
Achievement |
|---|---|---|
| Return on equity | 6.0% |
6.4% |
| Return on capital employed | 7.7% |
8.0% |
| Net profit after tax | $84.3 million |
$90.1 million |
| Gearing | 35.3% |
35.7% |
| Property investment holding period | 1.9 years |
1.7 years |
| Ordinary dividend | $50.6 million |
$54.0 million |
Major outcomes
Overview
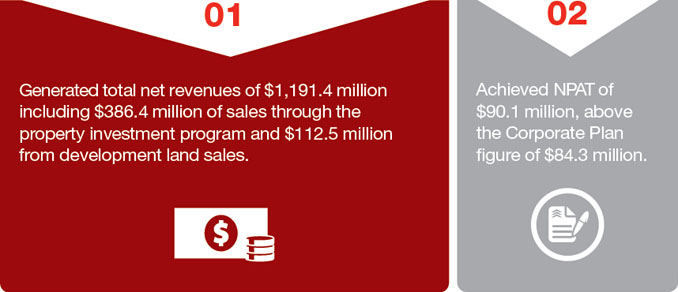
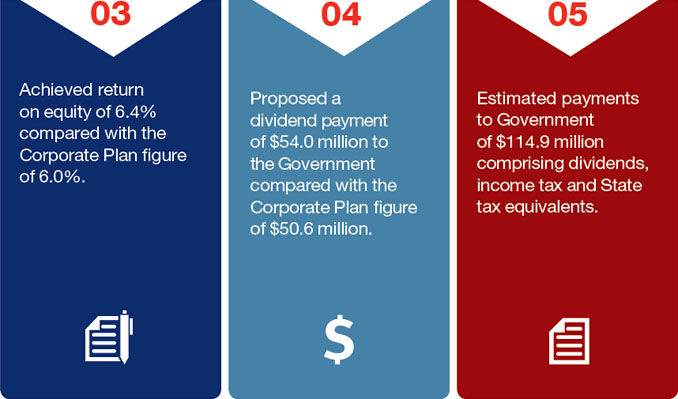
A strong financial position and capital structure was maintained through 2013–14. DHA's NPAT was $90.1 million against a Corporate Plan figure of $84.3 million. As a result, a dividend of $54.0 million will be proposed to Shareholder Ministers for payment to Government in relation to the 2013–14 financial year. DHA delivered returns of 8.0% on total capital employed and a 6.4% return on the Government's equity investment. Both outcomes were above the budget figures for the year.
Operating results
Total net income were $1,191.4 million compared with $1,041.2 million in 2012–13 and were generated primarily through housing services revenue earned from Defence and property and land sales.
Expenses totalled $1,079.4 million, compared with $942.0 million in 2012–13. The increased expenditure was mainly the result of higher property rental expenses, costs associated with development and capital services, and higher personnel expenditure.

Rental outlays to lessors for residential properties totalled $336.0 million. This was an increase of $19.0 million or 6.0% compared to 2012–13 and flowed from a general increase in market rents and an increased number of leases.
Financial performance is reported in accordance with Australian and international accounting standards. DHA's financial performance in 2013–14 was affected by an additional charge of $4.5 million in relation to the lease restoration or make-good provision and $3.4 million in relation to its provision for redundancy (recognised to provide for organisational changes). Despite these charges DHA has met its principal financial targets for the year.
Returns to shareholders
In accordance with guidelines for GBEs, an annual dividend payment is made to the Government as the owner of DHA. The Board proposed to Shareholder Ministers a dividend of $54.0 million for the 2013–14 financial year, representing 60% of NPAT.
DHA fully complies with the Commonwealth's Income Tax, Fringe Benefits Tax and Goods and Services Tax legislation. DHA is also required to comply with the Government's competitive neutrality policy ensuring that it is not able to enjoy a commercial advantage resulting from tax exemptions flowing from its status as a GBE. In accordance with this policy, State tax equivalent payments are made to the Australian Government in respect of State taxes that would be applicable except for the exemption provision in the DHA Act.
In relation to income tax, it is estimated DHA will pay $23.4 million to the Australian Taxation Office for the 2013–14 financial year. An interim payment of $29.8 million was made on 30 June 2014 in relation to State tax equivalent liability and DHA has provided for equivalent amounts of $11.0 million for stamp duty, $22.3 million for land tax, $4.2 million for payroll tax and $54.0 million for the proposed dividend. In total, DHA will pay $114.9 million to the Government in relation to the 2013–14 financial year.
Residential property markets
DHA's financial performance is affected by costs and income associated with land development, construction activity, property sales and property portfolio management. All four areas are dependant on the state of residential property markets across Australia. During the 2013–14 financial year, there have been relatively soft conditions in residential property markets in many capital and regional cities, although strong capital growth occurred in Sydney. National rental growth was modest compared to 2012–13. Despite these conditions, property sales targets were achieved and principal financial targets were met in 2013–14.

DHA property portfolio
As at 30 June 2014, 18,577 properties were managed across Australia worth approximately $10 billion. Of these properties, close to two-thirds are owned by private investors and leased to DHA under market-based arrangements. The majority of the leases were established under the property investment program. DHA owned 3,426 properties or 18.4% of the portfolio at 30 June 2014, with 2,390 being held as long-term investment stock and the balance being inventory properties identified for sale through the property investment program.
In accordance with relevant accounting standards, inventory properties are held at the lower of cost and net realisable value and investment properties are held at the lower of cost and recoverable value. DHA's inventory and investment properties and land holdings are valued by licensed property valuers on an annual basis. Investment and inventory properties are carried in the financial statements at $1.8 billion at 30 June 2014. The market value of these properties is $2.6 billion.
Surplus property sales
An important element of DHA's asset and portfolio management strategy is the sale of surplus properties. In 2013–14, $54.6 million in revenue was generated from this source. Surplus housing stock is identified on the basis that it no longer meets the operational requirements of Defence, is positioned in an unsuitable location, or does not meet the Defence minimum amenity standards.
Development land sales
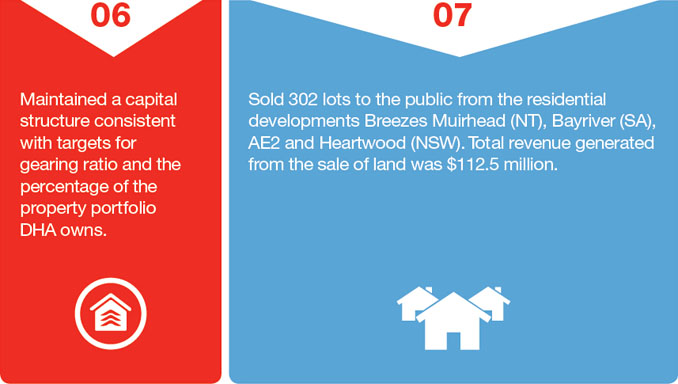
DHA has a number of major residential developments across Australia that will assist in meeting Defence housing requirements. Land lots not required for this purpose are sold on the open market. In 2013–14, 302 lots were sold to the public from the residential developments Breezes Muirhead (NT), Bayriver (SA), AE2 and Heartwood (NSW). Total revenue generated from the sale of land was $112.5 million.
Capital structure
DHA employs total capital of almost $2.0 billion, which is funded through $1,428.9 million in equity and $509.6 million in debt. The equity is provided by the Government (as the owner of DHA) and the debt arrangements are provided through a loan arrangement with the Government. At 30 June 2014, gearing was 35.7% and the financial results for the year provided interest cover at 5.1 times.
A primary source of funding is the sale of properties through the property investment program. Therefore, DHA focuses on maintaining the attractiveness of properties to individual investors. The overall sales objective is to achieve sufficient revenues from the sale and leaseback of inventory properties to help to keep net cash from operating activities positive over the cycle.
DHA has loan arrangements through the Department of Finance (Finance) and Defence. DHA does not have a commercial overdraft facility or access to re-drawable loan facilities. There were no new borrowings in 2013–14.
Standard & Poor's credit rating
Standard & Poor's credit rating has assigned DHA a long-term issuer rating of AA+. The credit rating assists DHA when negotiating financial transactions.
Table 5: Financial summary
2009–10 |
2010–11 |
2011–12 |
2012–13 |
2013–14 |
|
|---|---|---|---|---|---|
| Net profit after tax (NPAT) | $87.8m |
$87.3m |
$82.8m |
$85.1m |
$90.1m |
| Annual dividend | $52.7m |
$52.4m |
$49.7m |
$51.1m |
$54.0 m |
| Return on equity | 7.3% |
6.7% |
6.2% |
6.2% |
6.4% |
| Return on capital employed | 8.8% |
8.4% |
7.9% |
7.5% |
8.0% |
| Value of portfolio under management | $8.6b |
$8.9b |
$9.0b |
$9.0b |
$9.5b |
| Total managed stock (stock numbers) | 18,058 |
18,394 |
18,279 |
18,304 |
18,577 |
| Constructions and acquisitions1 | 1,1302 |
1,0782 |
767 |
649 |
790 |
| Revenue—disposal of surplus stock | $40.9m |
$55.6m |
$53.2m |
$51.2m |
$54.6m |
| Revenue—from property investment | $327.6m |
$367.0m |
$324.9m |
$353.4m |
$386.4m |
| Contracted maintenance to DHA-managed properties | $44.2m |
$43.7m |
$45.3m |
$46.4m |
$48.0m |
1 These numbers relate to total managed stock.
2 These figures include constructions funded by the Nation Building-Economic Stimulus Plan.